
Local considerations
Urban-Rural Somerset
Somerset Council serves over 570,000 residents and 250,000 households in areas which range from remote rural dwellings to urban town, and small city, centres.
Somerset – Ethnicity
At the time of the 2021 Census, 96.3% of Somerset’s residents identify themselves as belonging to a white ethnicity group and, approximately 3.7%, identifying as non-white ethnicities. Despite non-white ethnicities constituting a small proportion of Somerset’s residents, ethnic diversity is increasing in Somerset (from 2% in the 2011 Census).
| Race and Ethnicity: | Count of Usual Residents | Percentage of Usual Residents |
|---|---|---|
| Asian, Asian British or Asian Welsh | 8658 | 1.51% |
| Black, Black British, Black Welsh, Caribbean or African | 2436 | 0.43% |
| Mixed or Multiple ethnic groups | 7137 | 1.25% |
| Other ethnic group | 2469 | 0.43% |
| White: English, Welsh, Scottish, Northern Irish or British | 521833 | 91.30% |
| White: Gypsy or Irish Traveller, Roma or Other White | 26387 | 4.62% |
| White: Irish | 2630 | 0.46% |
Figure 1: 2021 Census: Race and Ethnicity Status by Number of Individuals.
Somerset – Religious and Spiritual Beliefs
Somerset’s religious and spiritual beliefs are predominantly Christian (50.1%), followed by no religion (41.5%). Hinduism (0.19%), Judaism (0.08%), Buddhism (0.34%), Sikhism (0.03%) and Islam (0.45%), constitute 1.09% of Somerset residents religious and spiritual belief. 0.69% of Somerset’s population also describe themselves as following other religions.
| Religious Status | Count of Usual Residents | Percentage of Usual Residents |
|---|---|---|
| Buddhist | 1930 | 0.34% |
| Christian | 286672 | 50.16% |
| Hindu | 1104 | 0.19% |
| Jewish | 451 | 0.08% |
| Muslim | 2598 | 0.45% |
| No religion | 237262 | 41.51% |
| Not answered | 37379 | 6.54% |
| Other religion | 3962 | 0.62% |
| Sikh | 190 | 0.03% |
Figure 2: 2021 Census: Religion Status by Number of Individuals.
Somerset – English as a First Spoken Language
Over 99% of Somerset’s population speak English either as their main language, or to a good level as a secondary language. At the time of the 2021 census there were 515 Somerset residents aged over 3 who could not speak English, with a further 3244 who reported not being able to speak English well.
Somerset – Adults with Autism Spectrum Disorders
The number of older-aged adults (65+) with Autism Spectrum Disorders is forecast to increase up to 2040 with an 18.5% increase for individuals aged 65-74, (751 to 890) and a 50.7% increase for individuals aged 75+ (697 to 1051) (Figure 3). The number of working aged adults with Autism Spectrum Disorders are forecast to remain constant up to 2040 (Figure 4).
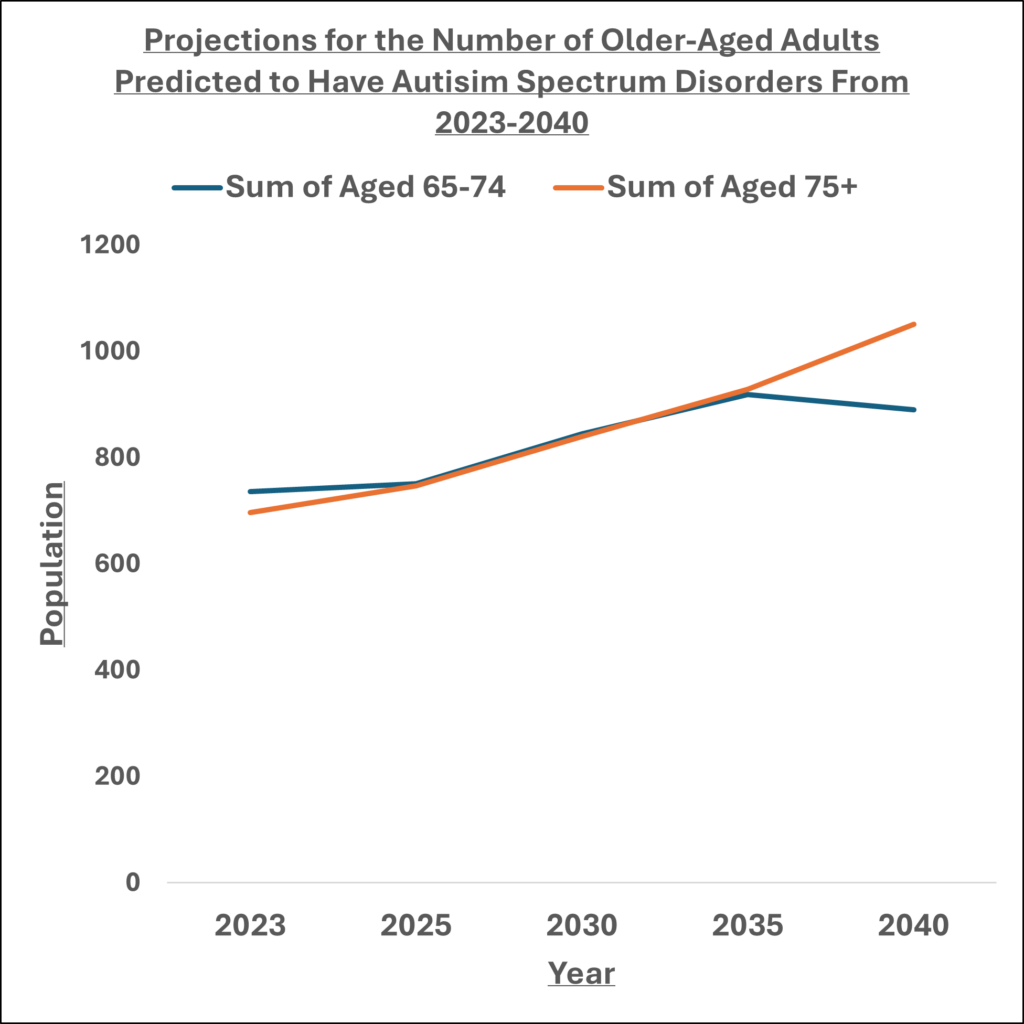
Figure 3: POPPI: Projections for Number of Older Aged Adults with Autism Spectrum Disorders (2023 – 2040)
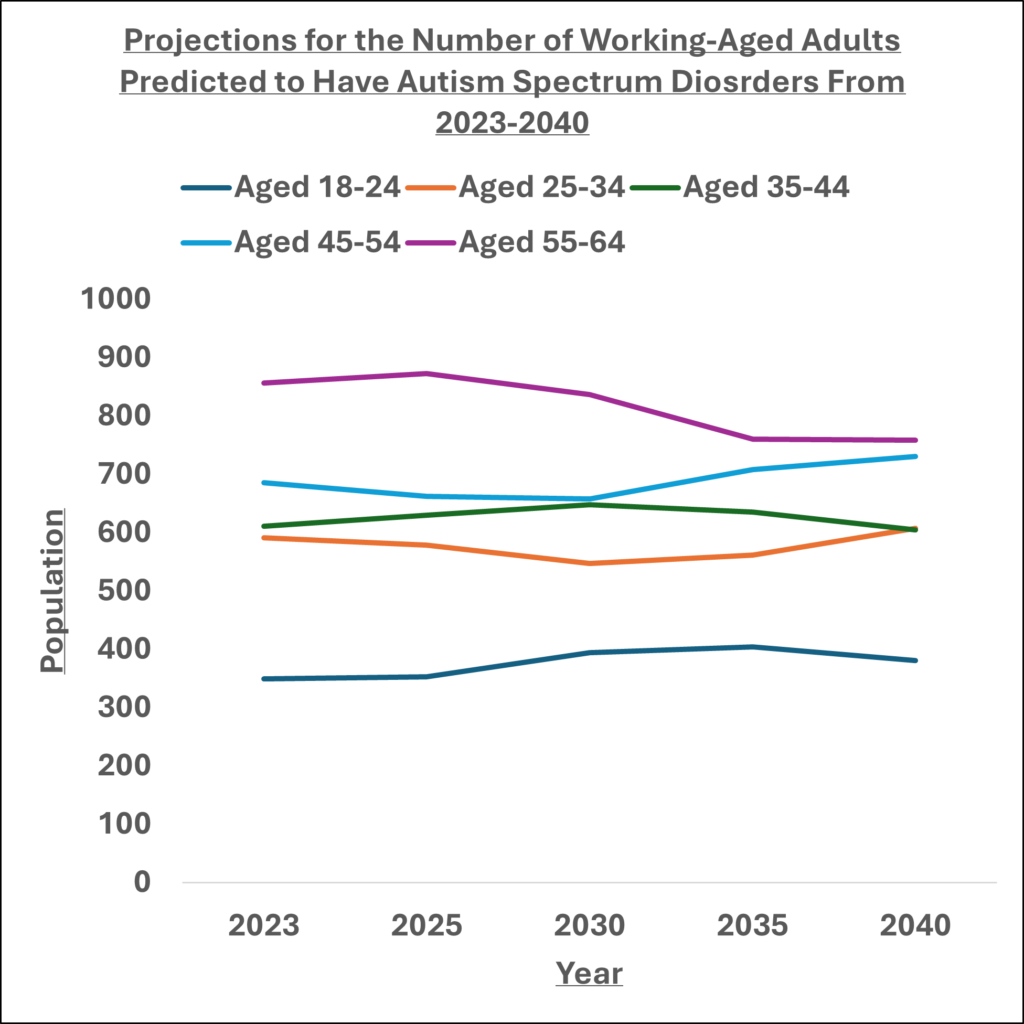
Figure 4 PANSI: Projections for Number of Working Aged Adults with Autism Spectrum Disorders (2023-2040)
Somerset – Adults with Learning Disabilities
The number of older-aged adults (65+) with Learning Disabilities is forecast to increase up to 2040 with a 20.6% increase for individuals aged 65-74, (1668 to 2012) and a 40% increase for individuals aged 75-84 (1121 to 1569) and a 84% increase for individuals aged 85+ (409 to 750) (Figure 5). The number of working aged adults (18-65) with Learning Disabilities are forecast to remain constant up to 2040 (Figure 6).
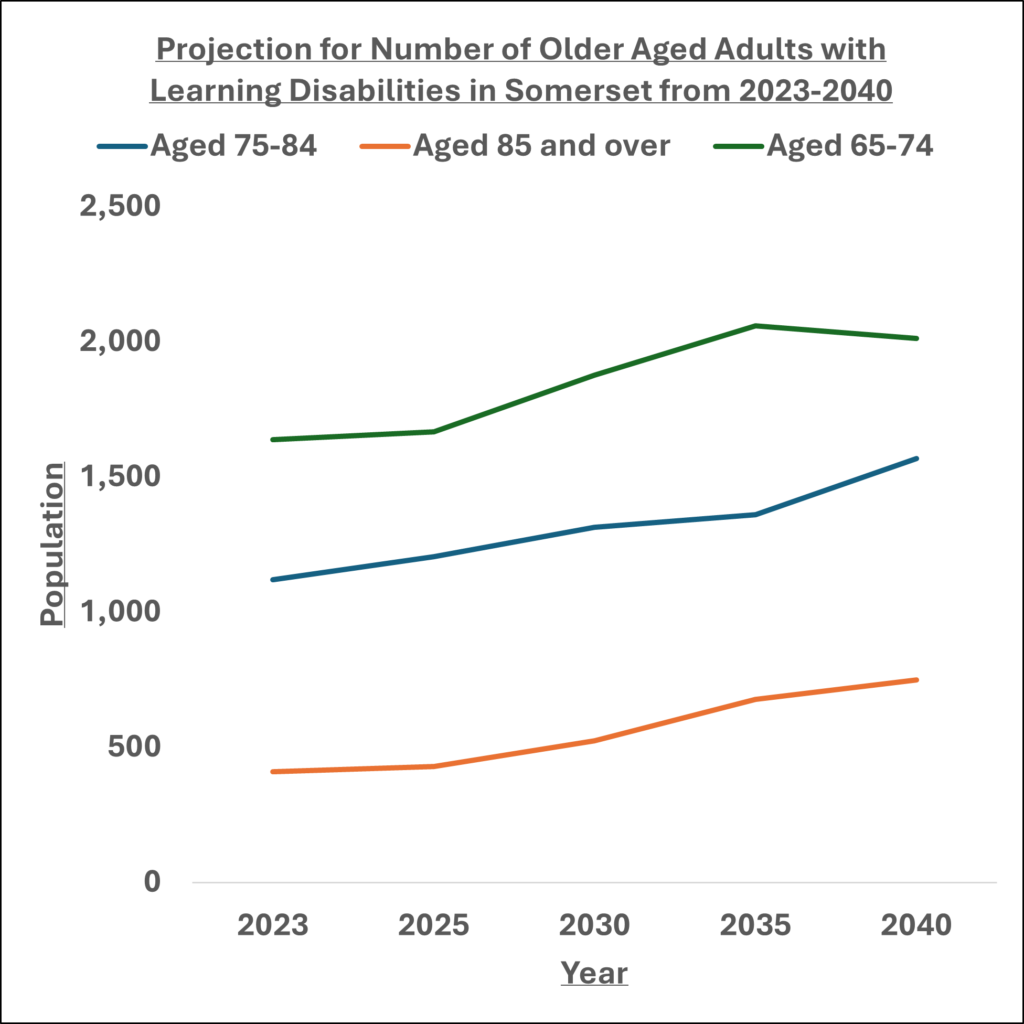
Figure 5: POPPI: Projections for Number of Older Aged Adults with Learning Disabilities (2023-2040)
Figure 6 PANSI: Projections for Number of Working Aged Adults with Learning Disabilities (2023-2040)
Somerset – Older Aged Adults Who Need Help with Self-Care or Domestic Tasks
The number of adults aged 65+ who require support with at least one selfcare activity, or at least one domestic task is projected to increase by 42.2 % up to 2040 (Figure 7).
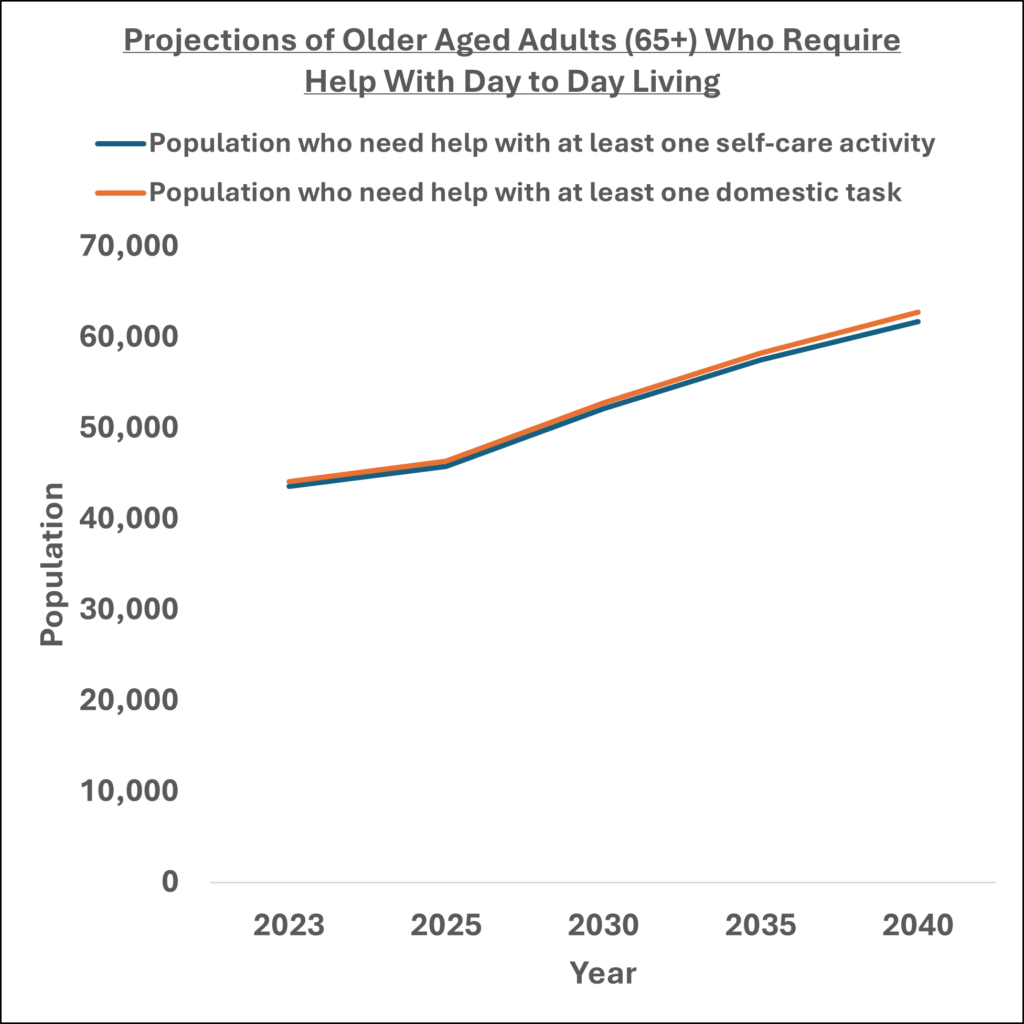
Figure 7: POPPI: Projections for Number of Older Aged Adults Who Need Help With One Self-Care Activity or Domestic Task.
Somerset – Working Aged Adults With Personal Care Disabilities
The number of working aged adults with moderate or serious personal care disabilities is projected to decrease by 3.56% up to 2040.
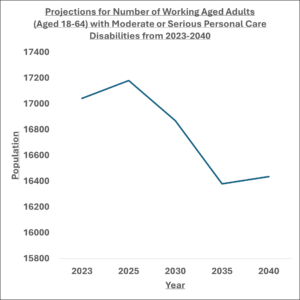
Figure 8: PANSI Number of Working-Aged Adults with Moderate or Serious Personal Care Disabilities.
Somerset – Working-Aged Adults with Mental Health Disorders
The number of working-aged adults with mental health disorders is projected to remain constant up to 2040.
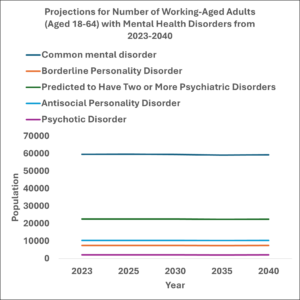
Figure 9: PANSI: Number of Working-Aged Adults with Mental Health Conditions
Somerset – Working-Aged Adults with Impaired Mobility
The number of working-aged adults with impaired mobility is projected to remain constant up to 2040, with the exception of the 55-64 age group, which is projected to decrease by 9.73%
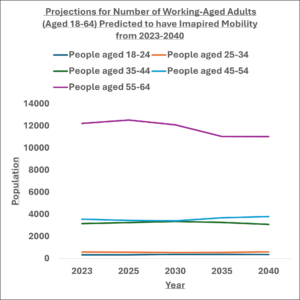
Figure 10: PANSI: Number of Working-Aged Adults with Impaired Mobility.